See what visitors do on your website, why some leave before asking for a quote, and which marketing brings the ones who buy.
You can see how many people visited, but not which of them asked for a quote, where the others gave up or which campaign brought the customers who actually signed. With analytics running on your own server and tied to the customer record, you can watch the visit that ended halfway through the quote form, measure every step from first page to submitted request, and judge marketing by the orders it brought rather than the clicks.
- Recordings of the visits that gave up
- From the first visit to the signed quote
- Your data on your own server
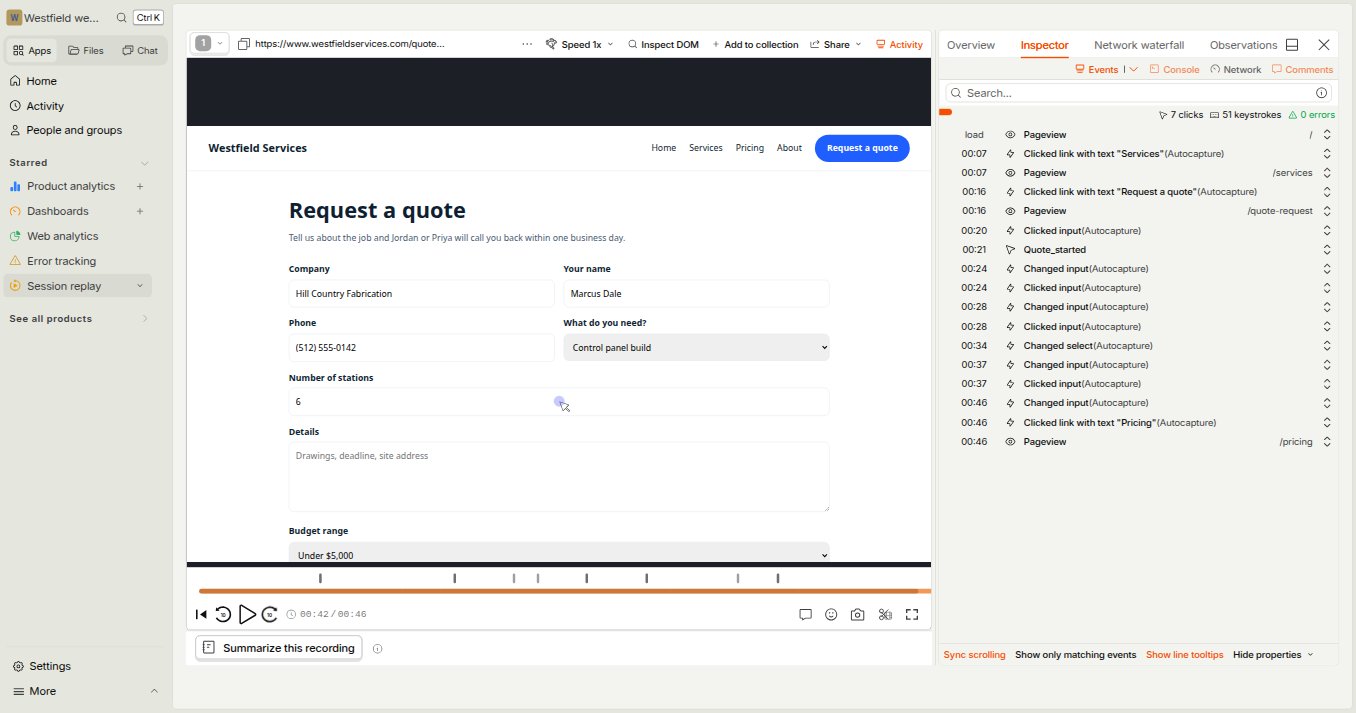
When someone starts a quote and gives up, watch their visit and see the moment the form lost them.
A report can tell you that a third of the people who open the quote form never send it. It cannot tell you why. Session replay can: open the visit of someone who gave up and follow it as it happened, the pages they read first, the fields they filled in, the question where the cursor hovered and stopped, the page they went to instead. The events run down the side, so you can jump straight to the moment that matters. Usually the answer is something nobody inside the company would notice, like a budget question asked too early or a field that rejects a phone number, and once you have seen it, the fix is obvious.
Recordings are found the way you think about them: everyone who started a quote and did not send it, everyone who saw an error, every visit from last week's campaign. Passwords and the fields you mark private are masked in the browser before anything is sent, and you decide how long recordings are kept.
- The visits that dropped out of a form, ready to watch
- Every click, page and field change on a timeline
- Errors and slow pages seen the way the visitor saw them
- Private fields masked before they leave the browser
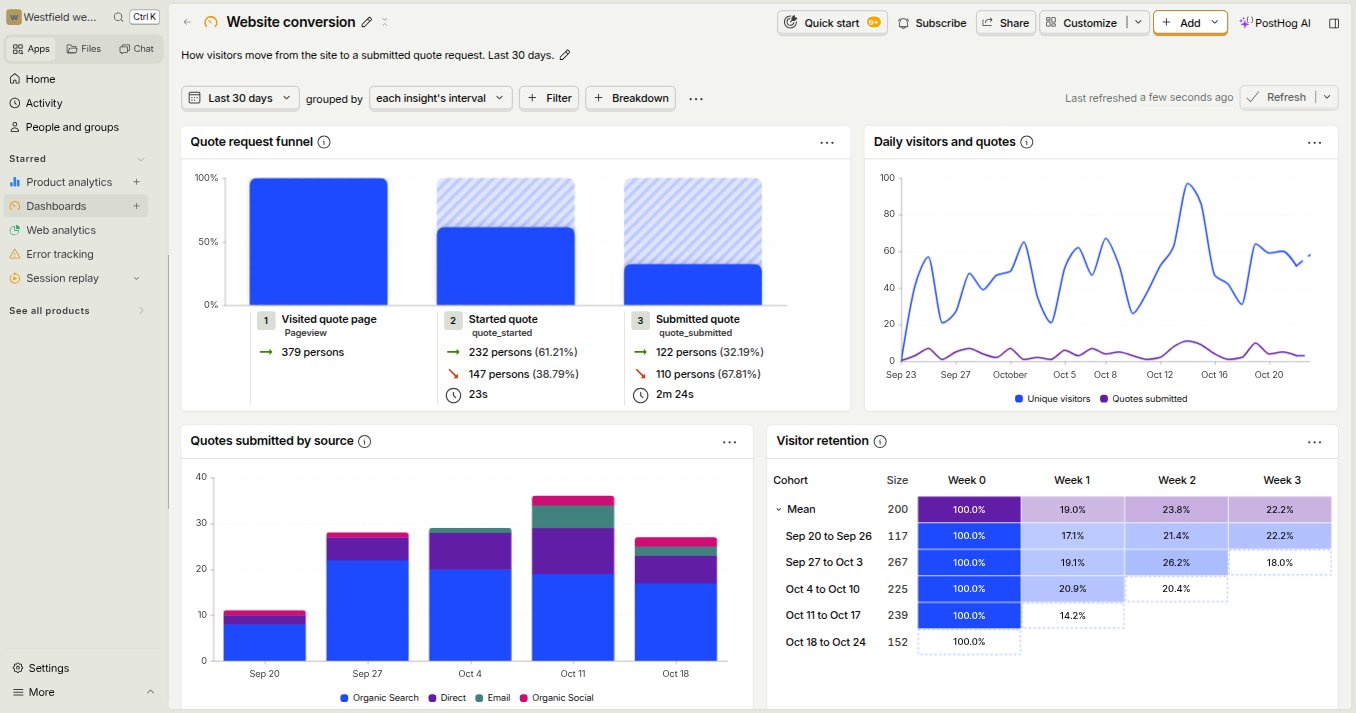
Measure every step from first visit to submitted quote, and prove that a change brought more people through.
Most website changes are made on a hunch and never checked. Here the path to a quote is a funnel: visited the quote page, started the form, sent it, with the number who stopped at each step and how long the rest took. Change the form and the funnel shows whether more people finish. Trends show which sources bring the requests, retention shows whether visitors come back, and one click from any drop in the funnel opens the recordings of the people behind it.
For a company that sells software, the same tools follow people inside the product: which features get used, by which accounts, and where new sign-ups stall. Feature flags let you switch a change on for a few customers first and turn it off without a release if something goes wrong, an experiment compares two versions on real visitors, and a short survey can ask the people who stopped what was missing, with each answer linked to their visit.
- A funnel for every form, with the drop at each step
- Quote requests by source, week by week
- Changes rolled out to a few customers first, with a switch to turn them off
- Short surveys that ask the people who stopped
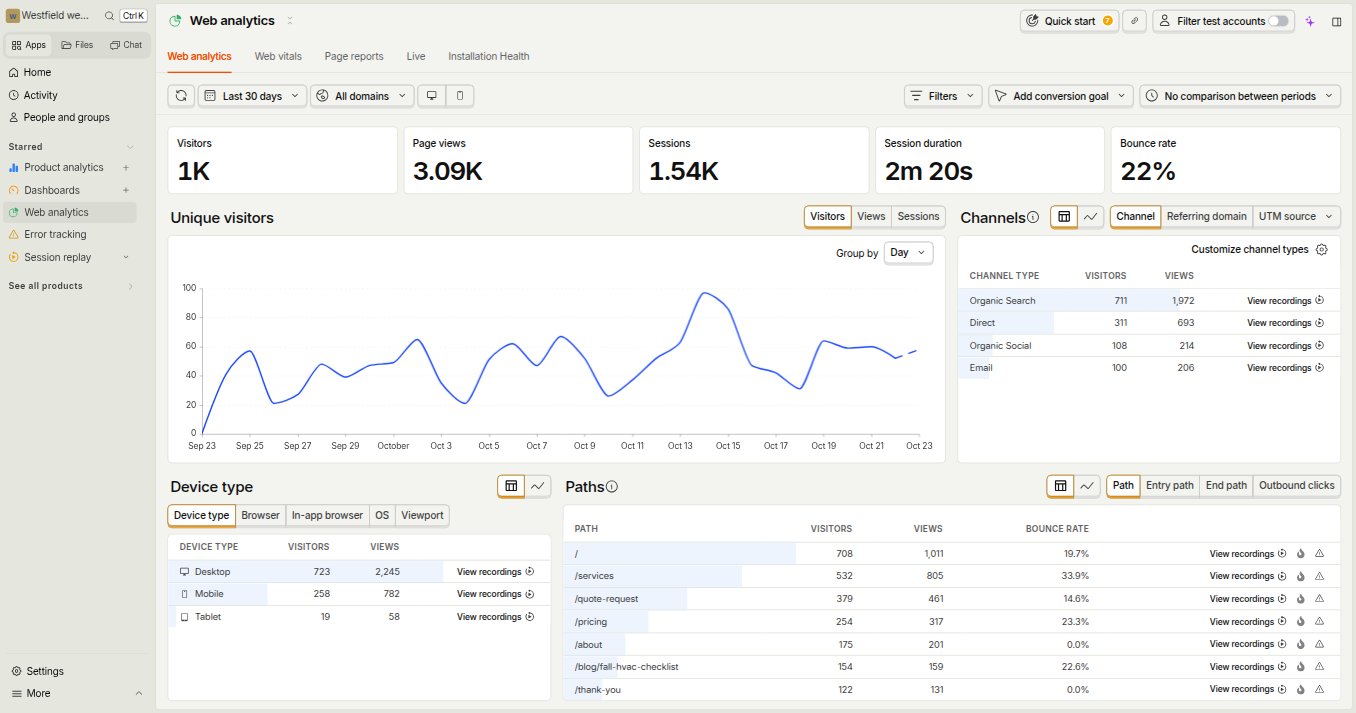
Know which pages bring people in and which ones send them away, without handing your visitors to an advertising company.
The free analytics most websites run on answers questions about ads, keeps your visitors' data on someone else's servers and still leaves you guessing. We set up PostHog, open-source analytics, on a server you own: visitors, page views, sessions and bounce rate, the pages people enter on and leave from, the channels and campaigns that sent them, and their devices and countries, on one screen. Every number opens the visits behind it, and a weekly summary goes to the team automatically.
- Visitors, sources and top pages on one screen
- Campaigns sorted into channels from their links
- Bots and crawlers kept out of the numbers
- Your visitors' data on your own server
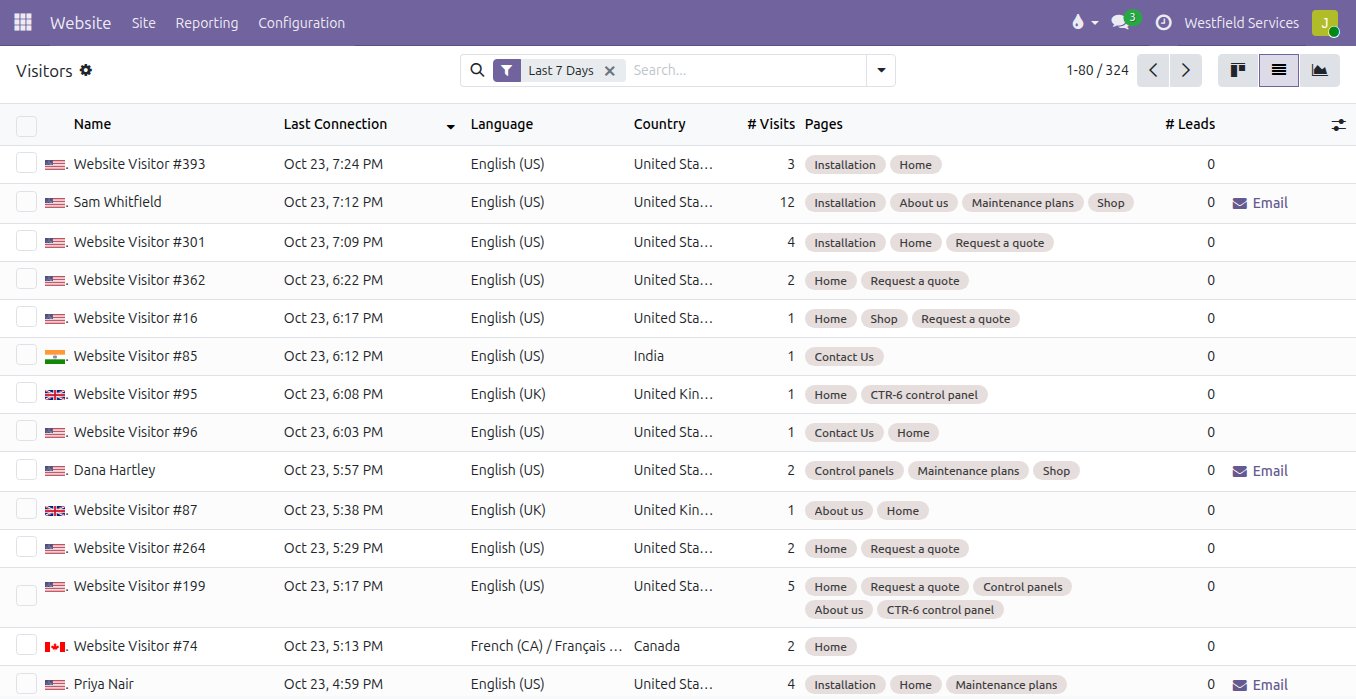
By the time a visitor fills in the form, the pages they read and the campaign that brought them are already on the lead.
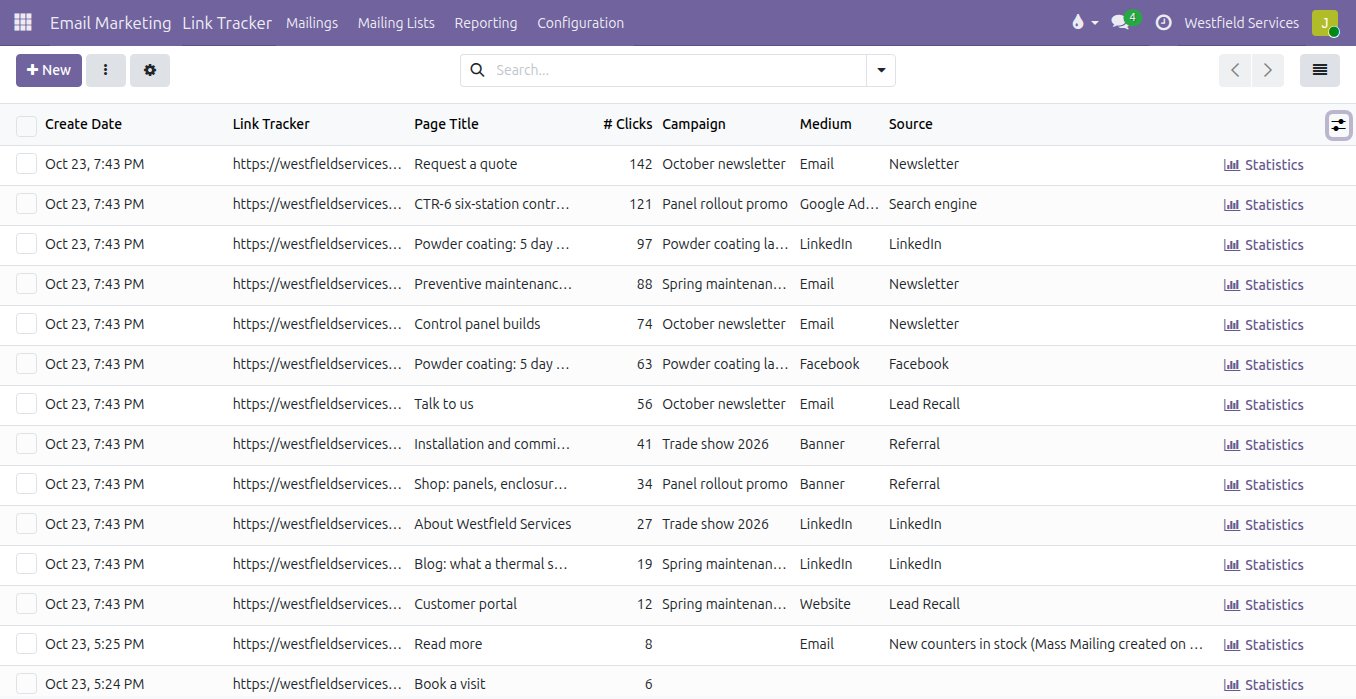
The question six months from now is which campaign paid for itself, and a click count cannot answer it. We are an Odoo partner, and its website tracks visitors itself: the pages each one read, how often they came back and where from. Your team can see who is on the site right now and start a chat with someone lingering on a service page. Every link you send out in an email, a post or an ad is a tracked link with its campaign, medium and source, and those travel with the visitor onto the lead when they fill in the form. The lead becomes the quote and the quote becomes the order, so the report on which campaign worked is a report on revenue.
- The pages a visitor read, on their lead
- A tracked link for every campaign, with its clicks counted
- Campaign, medium and source carried through to the order
- Marketing judged by the revenue it brought
What it is for
The questions marketing and product teams ask, answered from your own data.
Session replay
Watch the visits that gave up on a form or hit an error, and fix what stopped them.
Form funnels
The drop at every step from visit to sent request, before and after each change.
Campaign results
Source, medium and campaign carried from the first visit to the order, so spend is judged on revenue.
Visitors
Countries, devices, returning visitors, the pages that bring people in and the ones they leave from.
Product analytics
For software companies: feature usage, retention, experiments and flags to try a change on a few accounts first.
Surveys
A short question to the visitors who stopped, with every answer linked to their visit.
Your data, your server
Nothing sent to an advertising network, private fields masked, retention set by you.
Reports and alerts
A weekly summary to the team, and an alert when sign-ups or quote requests fall off.
Related
Business intelligence
Dashboards on one set of numbers everyone agrees on.
See business intelligenceEmail marketing
Campaigns to the right customers from your own records, measured in orders.
See email marketingSoftware as a Service
The back office behind the product: subscriptions, sign-on, support, email.
See the SaaS setupBusiness intelligence
Dashboards and reports on one reconciled set of numbers.
On the services pageSchedule a demo.
Tell us a little about your business and what you would like to see. We walk you through how this would work for a company like yours, at a time that suits you. The first conversation is free.