Get one set of numbers the whole company agrees on, on dashboards that update themselves.
Every week someone rebuilds the same spreadsheet, and two departments still turn up with different figures for the same thing. Dashboards for the owner, scheduled reports for the team and a clean pack for the accountant come from the same reconciled numbers, refresh automatically, and every figure is a link to the records behind it.
- Each metric defined once, in writing, before a chart is drawn
- Every figure a link to the records behind it
- Delivered on a schedule to email, chat or a screen on the wall
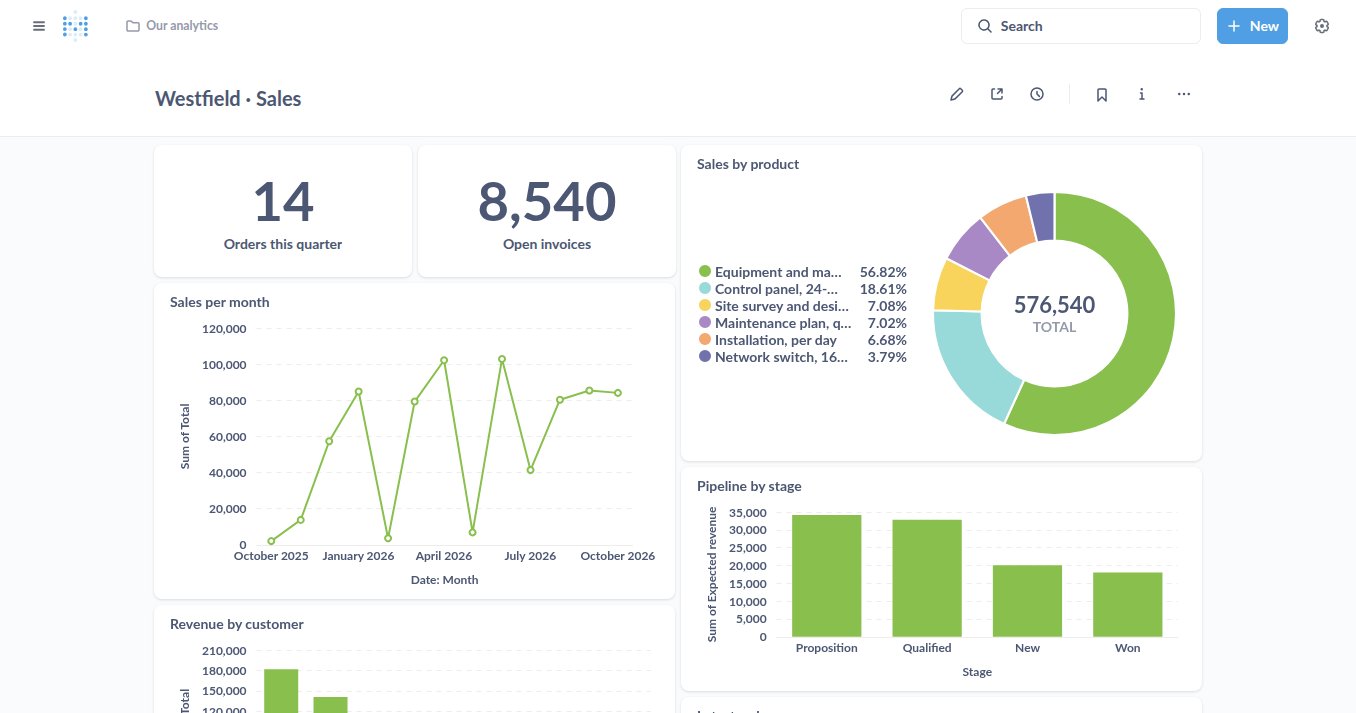
See sales, cash, margin and what is late on one page, and click any bar to the orders behind it.
The owner's question takes an afternoon: a report run, exported, cleaned up and sent round, and by then it is out of date. A dashboard shows revenue by month, by customer and by product, the pipeline by stage, open invoices and what is owed, read straight from the sales and accounting data on a schedule you set. A filter at the top changes every chart at once, so this quarter against last or one customer against the rest is one click, and a click on any bar opens the records that make it up, each one a link into the system.
- Sales, cash, margin and what is late on one page
- One filter changes every chart on the board
- Click a bar to open the records behind it
- Refreshed on a schedule from the live data, never from an export
The everyday questions are answered where the work is done, without anyone exporting anything.
Most questions are not board material: how many units went out last month, which products a customer buys, what is still to invoice. Every list in the system turns into a chart or a pivot with the filters you already use, grouped by month, customer, salesperson or product, and a view worth keeping is saved and shared with the team. The person who asks the question answers it, from the live records, and the answer is the same one the accounting shows.
- Any list becomes a chart or a pivot table in one click
- Group by month, customer, salesperson or product
- Saved views shared with the team
- Sales, projects, stock and the books on the same figures
Staff ask their own questions without a developer, and gross margin means the same thing on every chart.
The reporting tool is only used by the one person who knows the database, so every new question joins their queue. A question builder lets anyone filter, summarise and join the data in plain words and save the answer to a board, and the analyst writes SQL when a question needs it. Underneath, each metric is defined once and in writing, so open order, gross margin and active customer mean the same thing in sales, operations and finance, and a reporting database fed from your systems keeps heavy questions off the tools people work in.
- A question builder for the team, SQL for the analyst
- Metrics defined once, in writing, and reused on every chart
- Row and column permissions, so each person sees their own figures
- A reporting database with documented tables
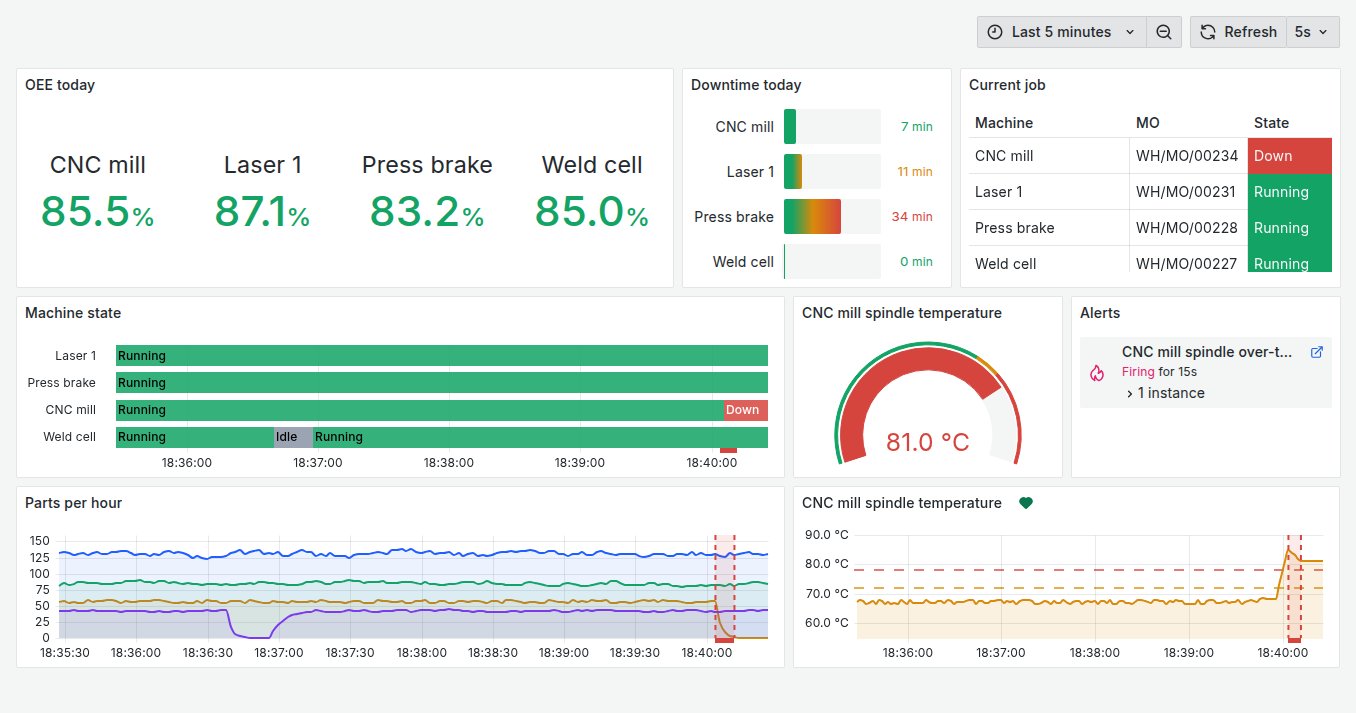
When the answer has to be now, a live board watches the floor and tells you the moment a number crosses the line.
Business intelligence answers what happened this month. For what is happening right now, on the floor and in the warehouse, a live board reads the operational data every few seconds, and an alert goes to the team chat, an inbox or a phone the moment a number crosses the line you set, with the reading in the message.
- A live board on a screen in the office
- Alerts to chat, email or SMS
- Machine and sensor data beside the business data
What it is for
The questions the owner asks every week, answered before they are asked.
Dashboards for the owner
The handful of numbers that matter, live on a screen in the office or a phone on the road: sales, cash, margin, what is late.
Self-serve questions
Staff ask their own questions without a developer and pin the answers to a board, with the figures linked back to the records.
Comparisons and drill-downs
This month against last, one customer against the rest, and a click on any bar to the records that make it up.
Scheduled delivery
The weekly summary in the owner's inbox, the daily figures in the team chat and the month-end pack for the accountant, without anyone logging in.
Alerts on a number
A message when sales fall behind the month, a customer goes over their credit or stock drops under the floor, with the figure in it.
Metric definitions and permissions
What "open order" or "gross margin" means in your company, agreed before a chart is drawn, and each person seeing the rows they are allowed to see.
Related
Real-time reporting
Every machine on one live board, with an alert before the line stops.
See real-time reportingWeb and product analytics
What visitors do on your website and which marketing brings customers.
See analyticsAccounting
Bank feeds matched automatically, bills read for you, books your accountant can work in.
See accountingBusiness intelligence
Dashboards and reports on one reconciled set of numbers.
On the services pageSchedule a demo.
Tell us a little about your business and what you would like to see. We walk you through how this would work for a company like yours, at a time that suits you. The first conversation is free.